Draw figure components
For most of the time, the chart should have many components, such as the axis, the mesh grid, etc. The ChartContext type is able to draw those component automatically.
Mesh
The following code demonstrate how we can use ChartContext::configure_mesh to add a mesh to the chart.
use plotters::prelude::*;

fn main() {
  let root_drawing_area = BitMapBackend::new("images/2.2.png", (600, 400))
    .into_drawing_area();

  root_drawing_area.fill(&WHITE).unwrap();

  let mut ctx = ChartBuilder::on(&root_drawing_area)
    .build_cartesian_2d(0..100, 0..100)
    .unwrap();

  ctx.configure_mesh().draw().unwrap();

}
And this code should produce the following result.

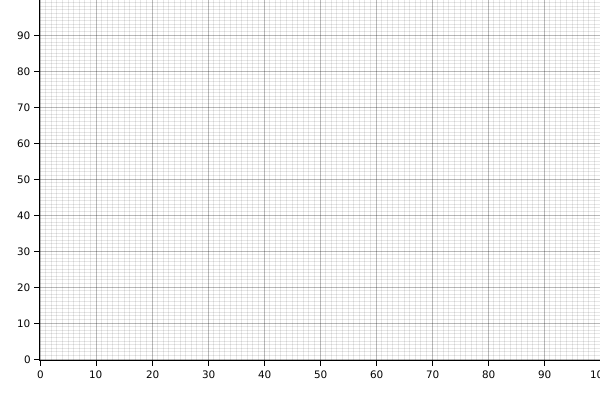
Axes
To add axes to the plot, it requires two steps:
- Define the label area size when the
ChartContextis created. - Use
configure_meshto draw the chart components.
The following code demonstrates how to add axes
use plotters::prelude::*;

fn main() {
  let root_drawing_area = BitMapBackend::new("images/2.3.png", (600, 400))
    .into_drawing_area();

  root_drawing_area.fill(&WHITE).unwrap();

  let mut ctx = ChartBuilder::on(&root_drawing_area)
    // enables Y axis, the size is 40 px
    .set_label_area_size(LabelAreaPosition::Left, 40)
    // enable X axis, the size is 40 px
    .set_label_area_size(LabelAreaPosition::Bottom, 40)
    .build_cartesian_2d(0..100, 0..100)
    .unwrap();

  ctx.configure_mesh().draw().unwrap();

}
The code above will result:
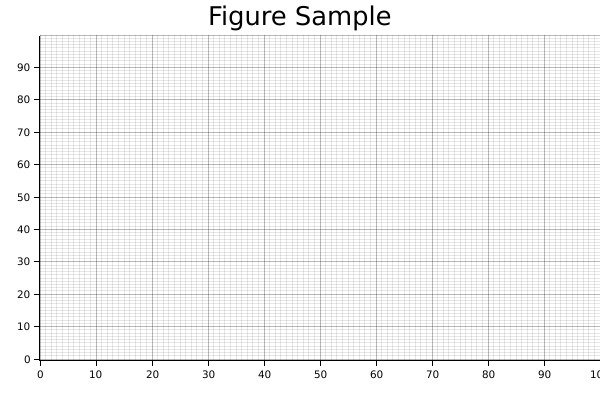
Title
The following example shows how to add title to the plot with ChartBuilder::caption.
In Plotters the most common way to represent a font is use a tuple of font face name and font size.
use plotters::prelude::*;

fn main() {
  let root_drawing_area = BitMapBackend::new("images/2.4.png", (600, 400))
    .into_drawing_area();

  root_drawing_area.fill(&WHITE).unwrap();

  let mut ctx = ChartBuilder::on(&root_drawing_area)
    .caption("Figure Sample", ("Arial", 30))
    .set_label_area_size(LabelAreaPosition::Left, 40)
    .set_label_area_size(LabelAreaPosition::Bottom, 40)
    .build_cartesian_2d(0..100, 0..100)
    .unwrap();

  ctx.configure_mesh().draw().unwrap();

}
The code above will result: