Layout Tweaks
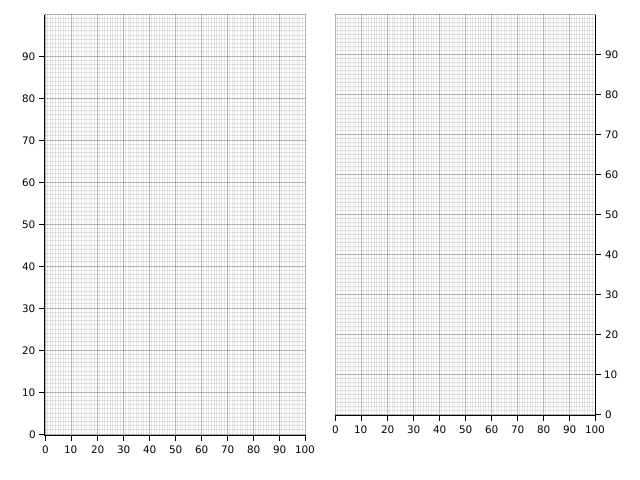
Label area size
To build a chart in Plotters, you need first define the axis specification and the dimension of the label areas. When a ChartBuilder is created, the label area size is set to 0, which means Plotters shouldn't draw the axis and tick marks. You can tweak the label area size with ChartBuilder::set_label_area_size.
use plotters::prelude::*;
fn main() {
    let root = BitMapBackend::new("images/label-area-size.png", (640, 480)).into_drawing_area();

    root.fill(&WHITE).unwrap();

    let (left, right) = root.split_horizontally(320);

    let mut left_chart = ChartBuilder::on(&left)
        .margin(15)
        .set_label_area_size(LabelAreaPosition::Left, 30)
        .set_label_area_size(LabelAreaPosition::Bottom, 30)
        .build_cartesian_2d(0..100, 0..100)
        .unwrap();
    let mut right_chart = ChartBuilder::on(&right)
        .margin(15)
        .set_label_area_size(LabelAreaPosition::Right, 30)
        .set_label_area_size(LabelAreaPosition::Bottom, 50)
        .build_cartesian_2d(0..100, 0..100)
        .unwrap();

    left_chart.configure_mesh().draw().unwrap();
    right_chart.configure_mesh().draw().unwrap();
}
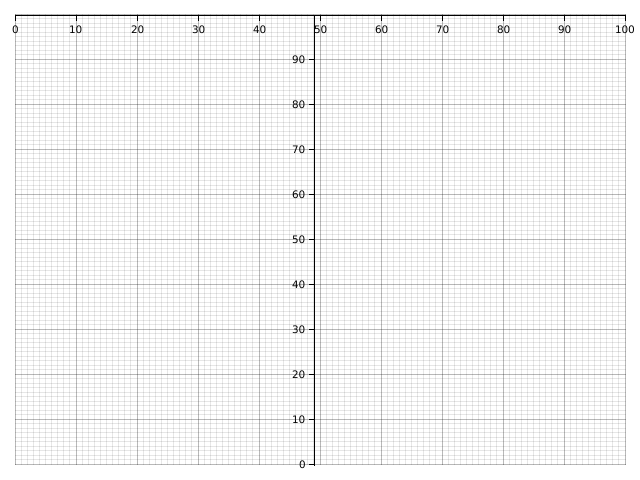
Floating label area
Sometimes we want our axis is drawn on the top of the plot area, this can be done if you set label area size to negative.
use plotters::prelude::*;
fn main() {
    let root = BitMapBackend::new("images/axis-overlapping-with-plot.png", (640, 480)).into_drawing_area();

    root.fill(&WHITE).unwrap();

    let mut chart = ChartBuilder::on(&root)
        .margin(15)
        .set_label_area_size(LabelAreaPosition::Left, -300)
        .set_label_area_size(LabelAreaPosition::Top, -30)
        .build_cartesian_2d(0..100, 0..100)
        .unwrap();
    chart.configure_mesh()
    .set_tick_mark_size(LabelAreaPosition::Left, 5)
    .draw().unwrap();
}
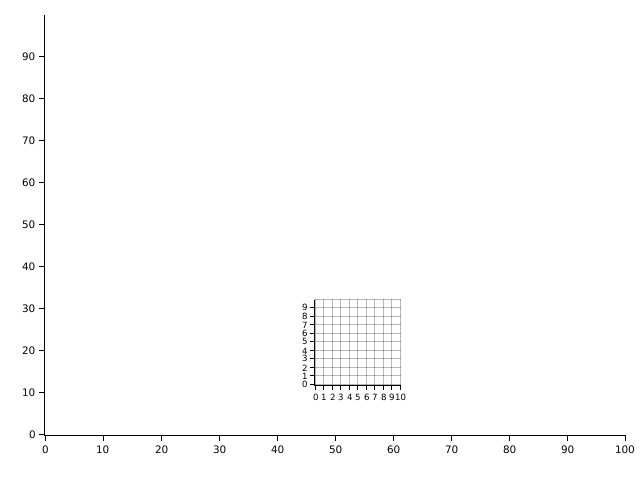
Overlapped charts
We have learned how to split the parent drawing area into some sub-drawing-area. But in some case, we want to intentionally set one chart on the top of another. This can be done by DrawingArea::shirnk. The following example demonstrates how.
use plotters::prelude::*;
fn main() {
    let root = BitMapBackend::new("images/overlapped.png", (640, 480)).into_drawing_area();

    root.fill(&WHITE).unwrap();

    let small_area = root.clone().shrink(
        (300, 300),
        (100, 100)
    );
    let mut chart = ChartBuilder::on(&root)
        .margin(15)
        .set_label_area_size(LabelAreaPosition::Left, 30)
        .set_label_area_size(LabelAreaPosition::Bottom, 30)
        .build_cartesian_2d(0..100, 0..100)
        .unwrap();
    chart.configure_mesh().disable_mesh().draw().unwrap();

    let mut small_chart = ChartBuilder::on(&small_area)
        .set_label_area_size(LabelAreaPosition::Left, 15)
        .set_label_area_size(LabelAreaPosition::Bottom, 15)
        .build_cartesian_2d(0..10, 0..10)
        .unwrap();
    small_chart.configure_mesh().draw().unwrap();
}