Multipanel figures
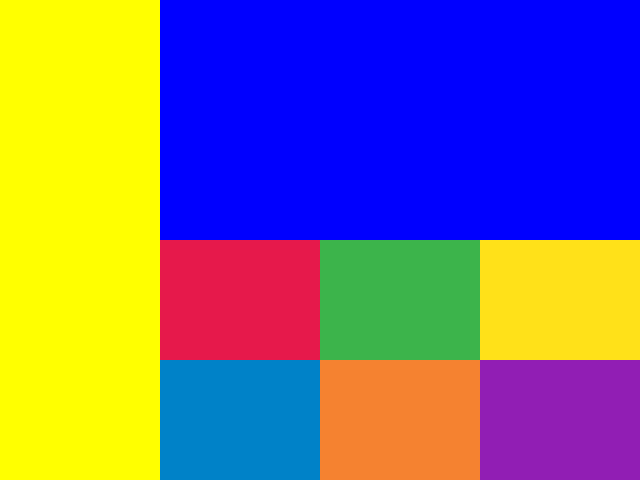
Splitting drawing areas
Plotters can support multiple panel figures very easily by splitting the drawing area into sub-drawing areas. The following code demonstrate how the drawing area is splitted.
use plotters::prelude::*;
fn main() {
    let root = BitMapBackend::new("images/split-drawing-area.png", (640, 480)).into_drawing_area();

    // We can split to left panel and right panel 25% left, 75% right
    let (left, right) = root.split_horizontally((25).percent_width());

    left.fill(&YELLOW).unwrap();

    // We can also split upper and lower panel
    let (upper, lower) = right.split_vertically(240);
    upper.fill(&BLUE).unwrap();

    // Then we can split the lower area evenly to 3 row 2 col
    let lower_areas = lower.split_evenly((2, 3));

    for (id, area) in lower_areas.into_iter().enumerate() {
        area.fill(&Palette99::pick(id)).unwrap();
    }
}
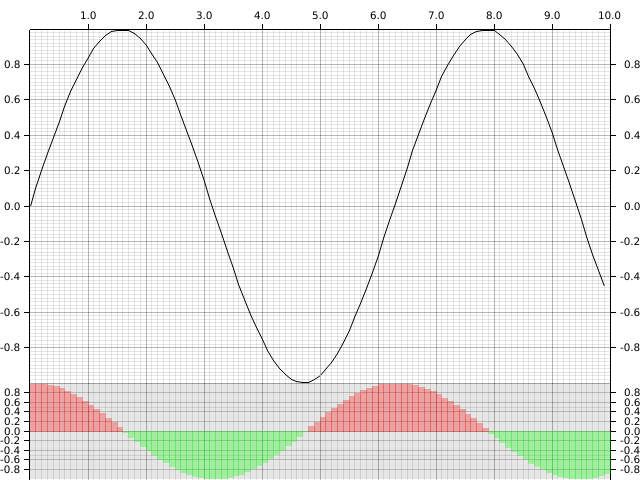
Creating multi-panel figures
With child drawing area, we can easily render multi-panel figures. Here's an example for making multi-panel figures:
use plotters::prelude::*;

fn main() {
    let root = BitMapBackend::new("images/multi-panel-figure.png", (640, 480)).into_drawing_area();
    root.fill(&WHITE).unwrap();
    let (upper, lower) = root.split_vertically((80).percent());

    let mut upper_chart = ChartBuilder::on(&upper)
        .set_label_area_size(LabelAreaPosition::Left, 30)
        .set_label_area_size(LabelAreaPosition::Right, 30)
        .set_label_area_size(LabelAreaPosition::Top, 30)
        .build_cartesian_2d(0.0..10.0, -1.0..1.0)
        .unwrap();
    upper_chart.configure_mesh().draw().unwrap();

    upper_chart.draw_series(LineSeries::new(
        (0..100).map(|x| x as f64 / 10.0).map(|x| (x, x.sin())),
        &BLACK,
    )).unwrap();

    let mut lower_chart = ChartBuilder::on(&lower)
        .set_label_area_size(LabelAreaPosition::Left, 30)
        .set_label_area_size(LabelAreaPosition::Right, 30)
        .build_cartesian_2d(0.0..10.0, -1.0..1.0)
        .unwrap();
    lower_chart.configure_mesh().draw().unwrap();

    lower_chart.draw_series(
        (0..100)
            .map(|x| x as f64 / 10.0)
            .map(|x| {
                let color = if x.cos() > 0.0 { RED.mix(0.3).filled() } else {GREEN.mix(0.3).filled()};
                Rectangle::new([(x, 0.0), (x + 0.1, x.cos())], color)
            })
    ).unwrap();
}