Draw 3D plots
Plotters also allows rendering 3D figures. Instead of using build_cartesian_2d, 3D plots are build with ChartBuilder by calling build_cartesian_3d method. Similar to the 2D figures, Plotters also can draw basic components for 3D charts.
3D plotting environment && basic figure component
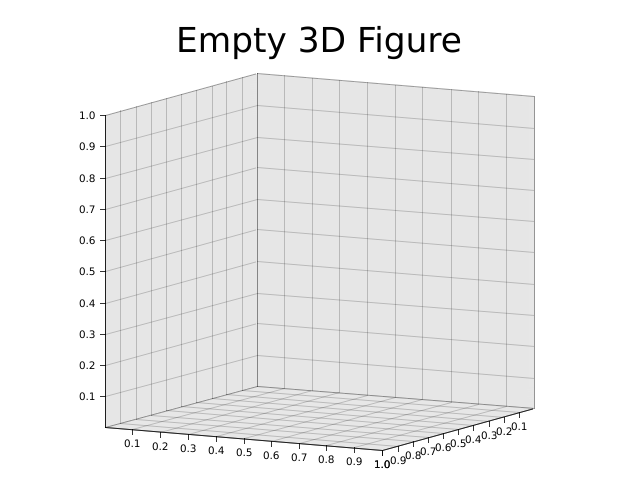
This following example demonstrate how to build a basic 3d plotting environment. Unlike 2d chart context, you need to configure configure_axes to build the basic component.
use plotters::prelude::*;
fn main() {
    let root = BitMapBackend::new("images/3d-env.png", (640, 480)).into_drawing_area();

    root.fill(&WHITE).unwrap();

    let mut chart = ChartBuilder::on(&root)
        .margin(20)
        .caption("Empty 3D Figure", ("sans-serif", 40))
        .build_cartesian_3d(0.0..1.0, 0.0..1.0, 0.0..1.0)
        .unwrap();
    chart.configure_axes().draw().unwrap();
}
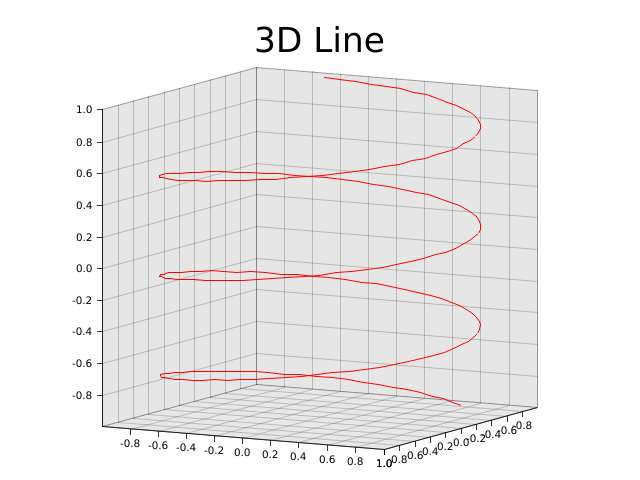
Draw a line series
In 3D plotting environment, you can draw a line series in the same way.
use plotters::prelude::*;
fn main() {
    let root = BitMapBackend::new("images/3d-line.png", (640, 480)).into_drawing_area();

    root.fill(&WHITE).unwrap();

    let mut chart = ChartBuilder::on(&root)
        .margin(20)
        .caption("3D Line", ("sans-serif", 40))
        .build_cartesian_3d(-1.0..1.0, -1.0..1.0, -1.0..1.0)
        .unwrap();
    chart.configure_axes().draw().unwrap();

    chart.draw_series(LineSeries::new(
        (-100..100).map(|y| y as f64 / 100.0).map(|y| ((y * 10.0).sin(), y, (y * 10.0).cos())),
        &RED
    )).unwrap();
}
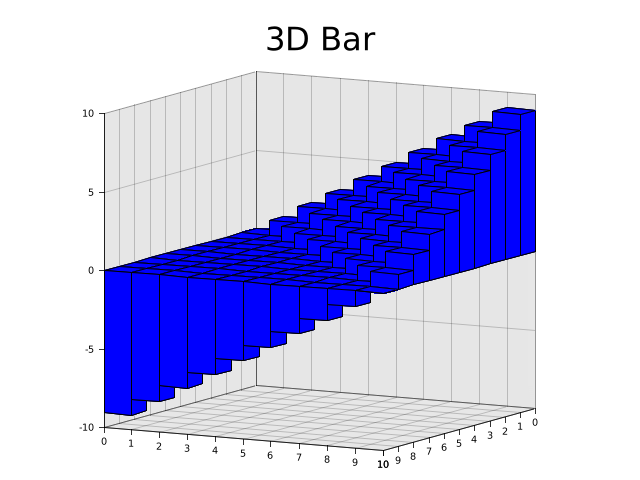
Draw a 3D bar chart
Note: This is currently only avaiable with developement version of plotters
Next, we are going to deomonstrate Plotters' 3D elements. We use the Cubiod 3D element to build a 3D bar chart.
use plotters_master::prelude::*;
fn main() {
    let root = BitMapBackend::new("images/3d-bar.png", (640, 480)).into_drawing_area();

    root.fill(&WHITE).unwrap();

    let mut chart = ChartBuilder::on(&root)
        .margin(20)
        .caption("3D Bar", ("sans-serif", 40))
        .build_cartesian_3d(0i32..10, -10i32..10, 0i32..10)
        .unwrap();
    chart.configure_axes().draw().unwrap();

    chart.draw_series(
        (0i32..10i32)
            .map(|x| std::iter::repeat(x).zip(0i32..10))
            .flatten()
            .map(|(x,z)| {
                Cubiod::new([(x, 0, z), (x + 1, x - z, z + 1)], BLUE.filled(), &BLACK)
            })
    ).unwrap();
}
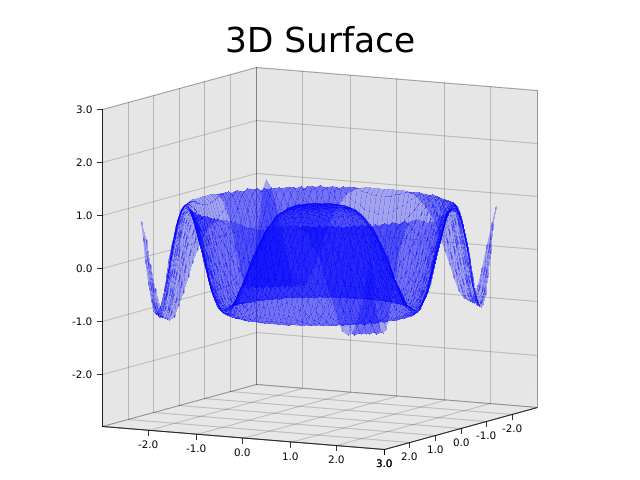
3D Surface
We can draw 3d surface as well by drawing a series of polygon. Here's an example of how to draw a surface plot.
use plotters::prelude::*;
fn main() {
    let root = BitMapBackend::new("images/3d-surface.png", (640, 480)).into_drawing_area();

    root.fill(&WHITE).unwrap();

    let mut chart = ChartBuilder::on(&root)
        .margin(20)
        .caption("3D Surface", ("sans-serif", 40))
        .build_cartesian_3d(-3.0..3.0, -3.0..3.0, -3.0..3.0)
        .unwrap();

    chart.configure_axes().draw().unwrap();

    let mut data = vec![];

    for x in (-25..25).map(|v| v as f64 / 10.0) {
        let mut row = vec![];
        for z in (-25..25).map(|v| v as f64 / 10.0) {
            row.push((x, (x * x + z * z).cos(), z));
        }
        data.push(row);
    }

    chart.draw_series(
        (0..49)
            .map(|x| std::iter::repeat(x).zip(0..49))
            .flatten()
            .map(|(x,z)| {
                Polygon::new(vec![
                    data[x][z],
                    data[x+1][z],
                    data[x+1][z+1],
                    data[x][z+1],
                ], &BLUE.mix(0.3))
            })
    ).unwrap();

}
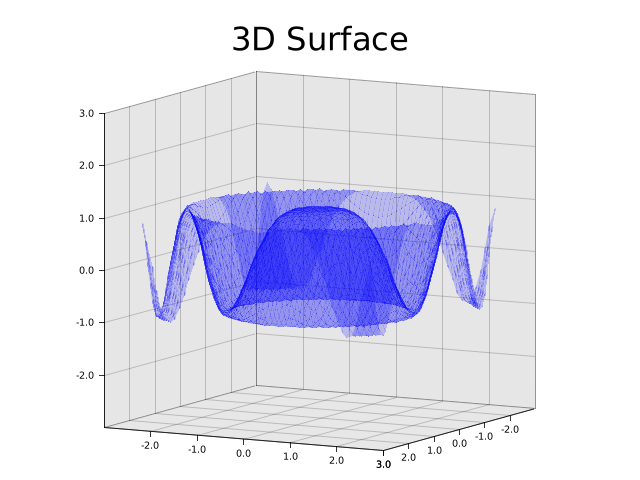
Drawing with surface series
Note: This feature is only avaiable in development version
use plotters_master::prelude::*;
fn main() {
    let root = BitMapBackend::new("images/3d-surface-series.png", (640, 480)).into_drawing_area();

    root.fill(&WHITE).unwrap();

    let mut chart = ChartBuilder::on(&root)
        .margin(20)
        .caption("3D Surface", ("sans-serif", 40))
        .build_cartesian_3d(-3.0..3.0, -3.0..3.0, -3.0..3.0)
        .unwrap();

    chart.configure_axes().draw().unwrap();

    chart.draw_series(SurfaceSeries::xoz(
        (-25..25).map(|v| v as f64 / 10.0),
        (-25..25).map(|v| v as f64 / 10.0),
        |x:f64,z:f64|(x * x + z * z).cos()).style(&BLUE.mix(0.2))
    ).unwrap();

}
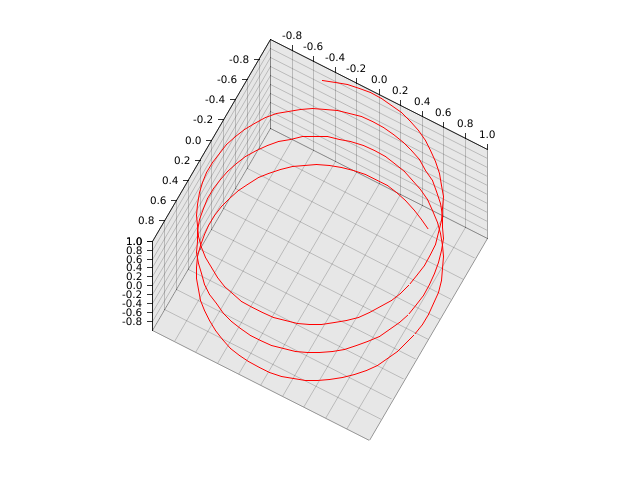
Customize perspective matrix
Plotters also allows user override the default prespective matrix, by doing so, you can zoom and rotate the 3d figure. The following example demostrate how.
use plotters::prelude::*;
fn main() {
    let root = BitMapBackend::new("images/3d-matrix.png", (640, 480)).into_drawing_area();

    root.fill(&WHITE).unwrap();

    let mut chart = ChartBuilder::on(&root)
        .margin(20)
        .build_cartesian_3d(-1.0..1.0, -1.0..1.0, -1.0..1.0)
        .unwrap();

    // You need configure the projection matrix before start drawing anything
    chart.with_projection(|mut pb| {
        pb.pitch = 1.2;
        pb.yaw = 0.5;
        pb.scale = 0.7;
        pb.into_matrix()
    });
    chart.configure_axes().draw().unwrap();
    chart.draw_series(LineSeries::new(
        (-100..100).map(|y| y as f64 / 100.0).map(|y| ((y * 10.0).sin(), y, (y * 10.0).cos())),
        &RED
    )).unwrap();

}